

Developing an app is always a challenge, especially when you think about the things you need to keep an eye on at the same time. Then it gets more complicated when the app is released and you need to track its performance somehow.
Here is an overview of key metrics in mobile apps. If someone asks you what is the difference between ARPU and ARPPU or Lifetime and Lifetime Value, just give them a link to this article.
Usually, applications are created with one simple goal - to make money. As you probably know, no one wants to give you money for nothing. Thus, to earn money, you need to make an effort and go through many stages.

This is how most mobile apps work:
- people download the app on their mobile device, then run the app (which is where we start using the word "users" instead of "people");
- if users like the application, they start using it from time to time, and if not, they don't use it or even delete it from their devices;
- If users really like the app, they use it again and again, and some particularly loyal users make in-app purchases with real money, bringing joy to both themselves and the developer.
Each milestone has its own metrics that should help you understand if your app is performing well and get feedback on user behavior. All discussed metrics are available for integration via the devtodev SDK.
Building a user base
So, once users have installed the application on their devices and launched it for the first time - after the first launch of the application, the person becomes a user. How many new users should be there? Of course, the more the better, but it really depends on your project. Most importantly, the number of new users must cover the outflow from the project, then the project will grow. The number of new users can be increased through advertising campaigns or the introduction of viral mechanisms into the project, then existing users will bring new ones.
After a while, there are more and more new users, and at some point you will want to know how many users have tried your application. To do this, there is the indicator Total Users, it shows how many users of your application are in the database on the selected date.
Saving users
Users who launched your app for the first time, whether they like it or not. If the user doesn't like the app, they will most likely leave it and not come back the next day.
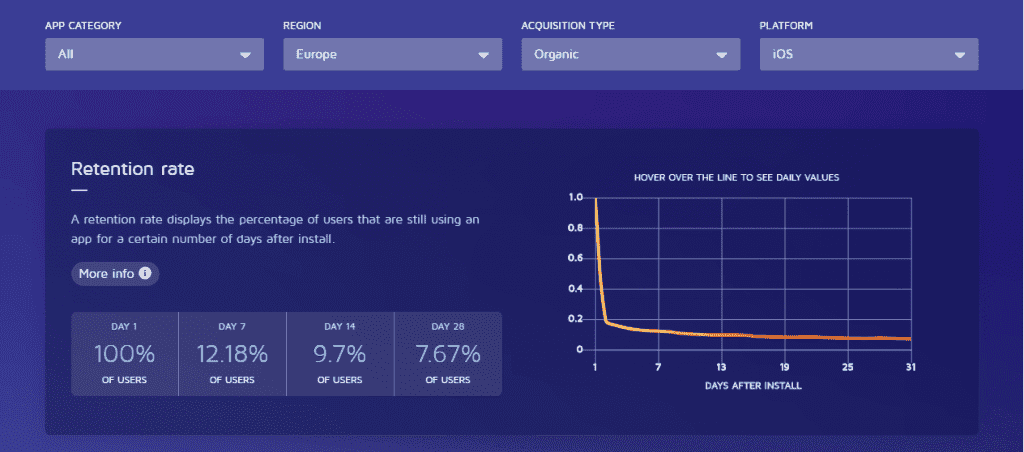
If the user returns to the app the day after the first launch, it means that the judgment of "how well" has passed the familiarity with the app. The percentage of users who returned the day after their first visit is called the 1-day retention period. This indicator should be monitored in dynamics and constantly improved, there is no limit to perfection. If the user doesn't come back the next day after the first visit, it means something didn't work for them, although it's most likely the front end. Try changing the interface for new users (add or change a tutorial; provide a hint to tell new users about the benefits of the app). If you did everything right, the next day the “1st day” indicator will change and go up. Losing users the next day is wrong, so always optimize this indicator.
The percentage of users who return after 7 days of their first visit is called the 7-day retention period. Finally, if users return 28 days after their first visit, the percentage of those users is referred to as 28-day retention. And this is getting serious. You can assume that users are really interested in your app if they stay with you even after 28 days.
In an ideal situation, all three retention rates will be 100% (the user will stay with you after 1, 7 and 28 days). But this is hardly achievable. Think about what the user experiences during the first week, during the first month, what might cause them to leave, and optimize those vulnerabilities. Custom Segments, Events, and Sequences can help you. All of these tools help determine the stages at which the user makes the decision to leave.
To calculate the retention period for other time periods (not just 1, 7 or 28 days), there is a measure called sliding retention. It shows how many users (as a percentage) who launch the application on the selected date are still active (here, by active users we mean all users who opened the application at least once in the last 7 days). As we approach the current day, this indicator grows. In this case, it's likely that you'll find spikes (a higher percentage of users who are still active) on the rolling retention chart, and then you'll have to deal with each of those spikes. These jumps can be caused by various reasons: advertising campaign settings or simple seasonality. In particular, we have to deal with the fact that people who come on Friday become a little more loyal, since they have free time on Saturday and Sunday to further explore your application.
User activity indicators
So, your application is already launched, new users appear, an audience has been accumulated. The number of unique users who logged into your app on a given day is called DAU (Daily Active Users).
The number of unique users who logged into your app during a week is called WAU (Weekly Active Users). Please note that WAU is not the sum of DAU for 7 days, it is unique users who visited your application during the week. The same user can visit your app every day for a week and then it will increase DAU by 1 each day, but WAU will also only increase by 1 because WAU doesn't consider repeat visits.
In the same way, the indicator MAU (Monthly Active Users) is calculated - the number of unique users who logged into the application during the month.
Indicators DAU, WAU, MAU determine the scope of your project. And it is about them that you will be asked first of all when concluding partnership agreements. Of course, all indicators should grow over time. To ensure their growth, it is necessary to maximize the flow of new users and retention rates.
It is also interesting to calculate the ratio, for example, DAU to MAU. This indicator is sometimes called the Sticky Factor and shows the regularity of user logs. If it is assumed that there are 1000 users in the project, and each of them registers them every day, then the DAU and MAU are 1000, and the Sticky Factor is 100%. If each user logged in only once during the month, the Sticky Factor is only 3.3%. The higher the value of this indicator, the more ordinary users enter your application.
It often happens that the DAU, WAU and MAU figures differ significantly due to the unstable flow of new users. To disregard these differences, there are metrics LDAU (Loyal Daily Active Users), LWAU and LMAU.
LDAU - the number of unique loyal users who launch the app on a given day. In this case, a loyal user is one who launches the app at least once a day after the first visit. Similarly, LWAU and LMAU.
It turns out that the closer the DAU and LDAU indicators are to each other, the fewer so-called "one-day" users (users who do not return to the application the next day after the first visit) in the application. ). Thus, the closer DAU and LDAU are to each other, the higher the 1-day retention.
Sometimes you may want to know how many users an application currently has. To do this, there is a metric Users Online, which estimates the number of users playing at the same time at a certain moment, and is updated every five minutes. This indicator is especially relevant for online games, where interest in the game depends on the number of simultaneously playing users.

Also pay attention to the maximum number of users online during the day. First, it will tell you the peak load on the server. Secondly, it will help determine the optimal time when the application has the maximum number of users (for example, to send push notifications). Third, it's a well-known metric for comparing the popularity of multiple apps.
Each visit to the app by a user is called a session, and the Sessions metric indicates how many sessions the app had during a period.
And if you divide the total duration of all sessions by the number of sessions, you get the indicator Average session duration. Thus, it cannot be said that a longer session is better than a shorter one. In applications for the Taxi service, the session is short: you only need to reserve a car, so the shorter the session, the more convenient the service. And, for example, in applications for reading, sessions are usually much longer.
The lifetime score shows the average number of days a user applies to an app from the first run to the last run. It is recommended to use this indicator for narrow user segments: for paid and non-paid users, for users who have reached a certain level. In this case, you will know the most likely lifetimes of users from each segment and will be able to offer the user what he will be interested in at the right time: push notifications, discounts and special offers, gifts, new quizzes, etc. In addition, the indicator lifetime can be used when planning any regular activities in your project (for example, advertising campaigns). Knowing the average time that a user spends in a project, you can set up events in such a way that for most users these events are new.
It is necessary to increase the lifetime value, because the longer the user is with you, the more loyal he is and the more likely he is to pay. Consider encouraging players to stay with you for a longer period. In online games, the lifetime is easily increased by introducing regular (daily, weekly) tasks for users.
Monetization Metrics
So users decide to pay money to buy content in the app. The number of unique users who pay per day (or longer) is displayed in the Paying Users metric.
TheMetric Paying Share shows the percentage of users out of all unique users active during the period who made payments. Ideally, every user pays and the paying share is 100%. In fact, this figure is much lower, and its growth of at least 1% is a great achievement for the project. According to Newzoo, in 2014, 32% of all mobile game users made payments. And this figure can be considered too high, since we are talking about the percentage of people who made at least one payment for at least one game during the year.
The increase in paying players can be by adding new content for purchases, changing prices, advertising campaigns with sales.
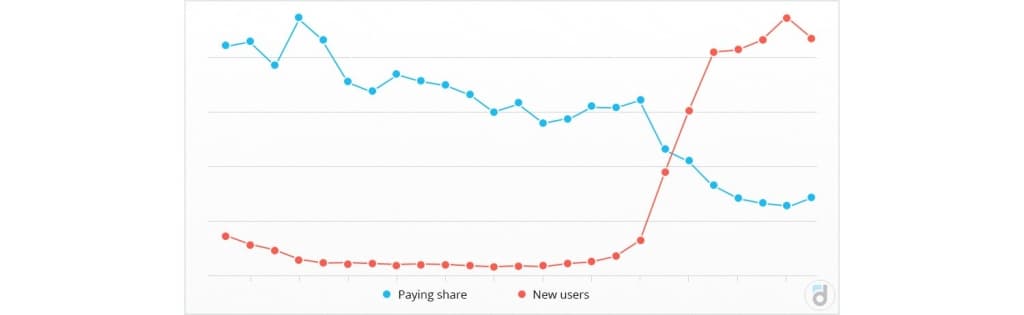
Payment conversion rate, in turn, shows for each day (or longer period) what percentage of paying users are among all those who signed up on that day (period). As with the trailing hold, try to find jumps in the behavior of this indicator. It is quite possible that he will indicate to you some conditions under which the percentage of paying users from the number of registered users is maximum (advertising campaigns, advertising banners, etc.).
Each payment by a user is a separate transaction in the database, while a single user can make multiple transactions within a period (you'd probably be happy about that).
The total number of transactions for the period is displayed in the Transactions metric. The Transactions by User shows the average number of transactions made by one paying user over the selected period. If no user has made repeated payments, then User operations are equal to one.
The total amount of all user payments for the period is displayed in the gross metric. However, the developer will not receive this money in full: the app store takes its commission. As a rule, the commission is 30%, so 70% of the gross goes to the developer and is displayed in the “Revenue” metric. If the fee is not 30%, it can be easily changed in the devtodev account settings.
In fact, it is for the Income indicator that you started developing your application.
Another important metric is the monetization metric, ARPU (average revenue per user). It is calculated as the sum of payments for the period (gross) divided by the number of unique players for the period (DAU, MAU, WAU). ARPU shows how much money one player receives on average, while both paid and non-paid users are taken into account. ARPU is ideal for measuring business performance and comparing multiple projects.
ARPU is useful to consider as a whole (at least for comparing the effectiveness of several projects) and separately for each user segment. In particular, you can calculate ARPU for new users and ARPU for the "core". The ARPU for new users will be significantly lower, but comparing it to the "main" ARPU will show you how important it is for new users to become "main".
Compare ARPU for different user levels, for different periods since the first launch. As a rule, the longer the user is in the project and the higher their level, the higher the ARPU.
ARPPU (Average Revenue Per Paying User) is calculated as the amount of payments per period (gross) divided by the number of unique paying players (paying users). ARPPU shows the level of prices in the application and how these prices affect paying users, how much money they are willing to spend over the period.
If every player pays, then ARPU is, by definition, equal to ARPPU.
To increase ARPPU, simply raise the prices in the project. The highest paying users will continue to pay, but ARPU (more important for measuring business performance) is in danger of falling.
Therefore, all steps to change the monetization of the project should be taken in such a way as to increase both ARPU and ARPPU. In online games, the introduction of new attractive content is most in demand for this purpose: more players start paying, and those who paid earlier start paying more to buy more attractive weapons. As a result, both the percentage of paying users and the average amount of payments increase during this period. In other words, Paying Share, ARPU, ARPPU is growing.
Also worth mentioning is the "Average check" indicator, which is calculated as Gross divided by the number of payment transactions. This is very similar to ARPPU, however ARPPU, unlike the average check, ignores repeated payments from the same paying user. If we assume that each paying user only paid once per period, the Average Check will be equal to ARPPU.
Last, but not least, is the Lifetime Value (LTV) indicator. It shows how much money the average user spends over the lifetime of the app. Many articles have been written about LTV, it is indeed one of the most important indicators of the effectiveness of the application, it combines both the duration of the user's activity and his payments.
Lifetime Value is useful for determining user acquisition costs. The rule is simple: the lifetime value must be greater than the cost of user acquisition, otherwise the business is not efficient.
In order to maximize LTV, it should be understood that Lifetime Value is both Lifetime and Value (in this case, ARPU). In other words, the longer a user stays with you and the higher the average income from him, the higher the LTV. The user should like the project, then the ARPU service life and after them the LTV increases.
Watch this metric for changes to understand the reasons, determine the factors that maximize LTV, and plan all changes in your project based on this metric.
It is also useful to consider LTV in the context of different user segments: by country or language, by registration date.
So we've looked at all the key metrics for apps. In truth, they are suitable not only for mobile applications, but also for online games, online shopping and other places.
Follow the dynamics of indicators, understand the reasons for their change in one direction or another, identify and apply the most effective factors.
We also recommend that you make your analysis as detailed as possible. Key metrics: ARPU, Sessions, retention period, etc. give an idea of the overall health of the project, and a deeper look at their behavior requires deep analysis. You can use custom segments for this, and you'll be able to look at each metric for each user segment separately.
We wish you the highest ARPU and lifetime extension.
And here's an exercise to make sure you're ready to go and apply your new knowledge.
Exercise
To see how you learned the material, we suggest you solve the problem.
February 1, 2015 110 people downloaded Test_application. 100 of them were launched. We assume that on other days, users did not download or run the app.
A week later, on February 8, 2015, only 30 unique users remained active in the app. Three users made payments that day: user_A paid $10, user_B paid $15, and user_C first paid $30 and then another $5.
You need to calculate the following indicators:
- 7-day hold;
- DAU 02/08/2015;
- Payment Share from 02/01/2015 to 02/08/2015;
- Payment for shares on 08.02.2015;
- Conversion payment 01.02.2015;
- Gross 08.02.2015;
- ARPU 02/08/2015;
- ARPPU 02/08/2015;
- Average bill 08.02.2015.